
A while back we shared an interesting presentation by Steven Feldman that looked at the history of Web Mapping. It really is fascinating to see how much mapping has advanced in the last decade compared to the last thousand years. With this kind of base to build upon, an article on Discovery’s website took this concept to the next level to make a fairly compelling case that we are living in the Platinum Age of Maps.
I highly recommend reading the article if you are half as interested in mapping as we are. Either way I wanted to share three high level takeaways from the article.
The Accessibility of Mapping
With smartphones and portable electronics we are carrying maps around with us all the time. No longer do you need to go into a gas station and pick up the map of the city or state to figure out where you are. We can now quickly and instantly access a map digitally through an array of hundreds of portable electronic devices. This innovation truly has changed the way we travel!
Also, not only is this data accessible anytime and all the time, but it is very easy to contribute to this map data. With free and open platforms like OpenStreetMap or social services like Waze and FourSquare we can easily contribute to making the mapping data around us better and more accurate. Waze, for example, takes your GPS and navigation data to provide real-time traffic and road info to a large and growing community. Not only can services like this present multiple options to get from point A to B, but they can actually help us act upon real time data from other users to determine if there is traffic, wrecks or other road problems that we should avoid.

Waze Coverage of New York
The Vast Data in Mapping
We were just talking about data services like Waze, but mapping in general allows us to collect and display “big data” in many meaningful ways as well. Just to be clear on what we mean by mapping, we are referring to the ability to take an array of elements and overlay them on another set of elements.
One of the most powerful things about mapping is its incredible use as a way to display data in an understandable manner. We might not be able to easily comprehend the number of people who live in an area, but when overlaid upon the map of the US pulling from census data it is very easy to visualize why certain states have more electoral votes in an election or see why New England is so populated for example.
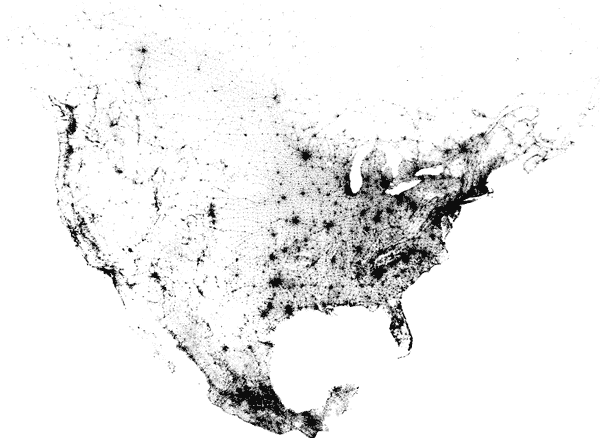
This is a map of every person counted by the 2010 US, 2011 Canadian, and 2010 Mexican censuses. The map has 454,064,098 dots – one for each person.
With cloud computing and big data projects becoming more and more popular there really are very few that aren’t using some form of mapping. Big data projects that relate to displaying data over a geographic map are some of the most meaningful projects because they relate to so many individuals.
Also, because we are getting better and better at collecting and structuring data we are opening up unlimited possibilities of ways to map all this data. Some of the interesting examples in the article include solar panel potential on buildings, showing the age of roads by shades of color and showing the various average speeds of buses as they zip around Boston.
New Understandings of the World We Live in
Finally, vast collections of data allow us to understand and analyze the world around us in ways never possible before. Two fascinating examples in the article are discovering lost ruins and tornado damage. Think about that first one for a second. We are able to use technology like shooting beams of light from a laser source mounted on a plane down into thick forests to scan for ruins that we have never been able to explore before. Instead of exploring miles of jungle that have been hidden from view, from the air we are now able to penetrate tree canopies and peak into miles of jungle at a time. Even walking it on foot there is no guarantee that the vegetation hasn’t gotten so thick that you would have missed signs anyway. And the same concept and technology is being applied to searching the seas!
By being able to collect data and map it we are learning more and more about where things might exist or how the world around us operates. We’re also able to do this on a scale never thought possible before through those big data projects.
We Are Still Early in This Platinum Age
There is so much data being collected and better tools to visualize it all that I believe we are still in the early innings of this Platinum Age. The question is what sort of mapping are you interested in seeing? Is the data available to map it now? If not it’s probably only a matter of time before someone starts collecting it and mapping it on their own.